EXAMPLE
Covered call
Illustrative example
- Underlying
- $200.00
- Premium income
- $420
- Breakeven
- $195.80
- Total position max profit
- $1,420
- Max loss
- -$19,580
- Expires
- 2026-10-16

Screen listed option contracts for covered calls, cash-secured puts, buy-writes, PMCC, spreads, iron condors and LEAPS. Compare premium, delta, liquidity, capital required and payoff risk across eleven strategy tools, then decide for yourself.
Premium is $29/month or $299/year after an eligible 7-day trial. Payment method required; bills automatically unless canceled. Log in
EXAMPLE
Covered call
Illustrative example, read-only. Hypothetical inputs run through TradingSignalAI's payoff model.
1 contract · 100 covered shares · expires 2026-10-16
Hover, touch, or focus the chart and use arrow keys to read P/L at a price.
The chart shows underlying prices from $171.80 to $234.00 only. Losses or gains outside this window can be larger; the window's lowest and highest points are not maximum risk.
Assumes 100 already-owned shares. Total-position P/L includes stock changes from the $200.00 signal reference, not historical cost basis. The existing Max profit income metric remains premium-only.
Uses the signal sell bid; before commissions, financing, exercise/assignment costs and taxes.
Move the pointer or focus the chart and use the left and right arrow keys to read profit or loss at each stock price. These are not live quotes or signals.
Each tool has its own filters and metrics because each strategy carries different risk.
Strategy tools
11
Income, spreads, long-dated
Education guides
13
Formulas and worked examples
Data basis
Snapshots
Timestamped, not streaming
Execution
None
You trade with your broker
Each diagram uses the same payoff calculation as the platform, on a hypothetical stock. Green is profit at the evaluation date, red is loss.
Shares plus a short call: premium is collected, upside stops at the strike, and the stock can still fall.
Profit zoneLoss zoneStock priceBreakeven
Cash set aside behind a short put: premium is collected and shares are bought at the strike if assigned.
Profit zoneLoss zoneStock priceBreakeven
Shares and a short call opened together, so the premium lowers the effective cost of the shares.
Profit zoneLoss zoneStock priceBreakeven
A long-dated call stands in for shares and a nearer call is sold against it. Two expirations, so the curve is modeled.
Profit zoneLoss zoneStock priceBreakeven
01
Market data
Timestamped stock prices and listed option chains.
02
Options analysis
Greeks, implied volatility, premium and capital for each contract.
03
Strategy filtering
Delta, liquidity and structure rules for the strategy you choose.
04
Opportunity ranking
Surviving candidates compared on a normalized basis, with warnings.
05
Trader review
You inspect the legs and payoff, then decide with your own broker.
Add holdings and available cash so covered calls and cash-secured puts are sized to what you hold.
Choose expiration and risk filters. Contracts that fail delta, liquidity or spread checks are removed.
Review premium, return per day, breakeven and capital side by side, and save favorites.
Open signal details and the payoff scenario. Place any order yourself, if you choose to.
A candidate table and its detail view, built from the platform's components with hypothetical contracts. Not live data.
Hypothetical contracts on one example stock at $200.00. Select a row to open its detail.
| Strike | Bid | Premium | Return | Per day |
|---|---|---|---|---|
| $5.60 | $560 | 2.80% | 0.215% | |
| $4.20 | $420 | 2.10% | 0.162% | |
| $2.30 | $230 | 1.15% | 0.088% |
Return is premium divided by the $200.00 share price. Candidates that fail your filters are removed, and an empty list is a valid result.
The same payoff chart component the platform uses, shown read-only.
1 contract · 100 covered shares · expires 2026-10-16
Hover, touch, or focus the chart and use arrow keys to read P/L at a price.
The chart shows underlying prices from $171.80 to $234.00 only. Losses or gains outside this window can be larger; the window's lowest and highest points are not maximum risk.
Assumes 100 already-owned shares. Total-position P/L includes stock changes from the $200.00 signal reference, not historical cost basis. The existing Max profit income metric remains premium-only.
Uses the signal sell bid; before commissions, financing, exercise/assignment costs and taxes.
Premium income is only the premium. The chart is the whole covered position: 100 shares from a $200.00 reference plus the short call. No live quotes.
Choose a structure to see its legs, capital and possible outcomes. Premium income and total position payoff stay separate; PMCC is a modeled scenario.
Hypothetical example. Not a quote or a result. Premium income and total position payoff are different figures.
Own 100 shares
Reference price $200.00 per share, a scenario baseline rather than your real cost basis.
Sell one $210 call
Strike is 5% above the stock. You give up gains above $210 at expiration.
Collect the premium
$4.20 bid x 100 = $420, received up front, before fees.
Premium income only
$420
The scanner's premium figure. Excludes any stock gain or loss.
Total covered-position payoff, best case at expiry
$1,420
$420 premium plus $1,000 of stock gain from $200 to the $210 strike. Breakeven $195.80, which is the $200 reference minus the premium.
Below the short strike
Stock $199.50
$370 P/L
The call expires unused. You keep shares and premium, and stock losses still count against you.
At the short strike
Stock $210.00
$1,420 P/L
Total position payoff is at its maximum. The call has no value at expiration.
Above the short strike
Stock $220.50
$1,420 P/L
Shares can be called away at $210, so the payoff stays capped however high the stock goes.
Short visual explanations of delta, implied volatility, time to expiration and premium.
Select a delta to see what it means for one call contract.
Out of the money, delta 0.30
Moderate sensitivity. Sold options here collect more premium than at 0.15 and are more likely to finish in the money.
One standard contract has about 30 shares of price exposure: roughly $30.00 per small $1 stock move, or $0.30 per quoted share, with other inputs held constant.
Delta is a model sensitivity, not a probability forecast. Values shown are examples, not quotes.
Example: $100 stock, 30 days to expiration. One-standard-deviation move = stock x IV x sqrt(days / 365).
Smaller expected range, lower premium for the same strike and expiration.
A middle reading for this example.
Wider expected range and larger premium, with more risk of a large move.
Bars span the one-standard-deviation range around the stock price. Not a forecast. IV rank in the product uses a realized-volatility proxy, not a historical implied-volatility rank.
How the time horizon changes what you are comparing.
0 DTE
Expiration day. Value is almost all intrinsic, and assignment can happen quickly.
7 DTE
Weekly. Time value is small and shrinks fast, and returns per day look large.
30 DTE
Monthly. A common window for comparing premium against time at risk.
45 DTE
Slower daily decay, more time for the stock to move against a position.
90 DTE
Quarterly. Premiums are larger in dollars but spread across more days.
365+ DTE
LEAPS range. Mostly time value early on, and used for long exposure, not quick income.
Descriptions are general tendencies. The scanner normalizes returns per day so different expirations can be viewed together.
Covered call example, hypothetical inputs.
Premium
$420
Capital
$20,000
100 shares at $200.00
Return
2.10%
13 days
Bar width = premium as a share of capital. $420 / $20,000 = 2.10%, or 0.162% per day over 13 days
Premium income only, before fees, taxes and any stock gain or loss. Per-day figures compare trades and do not promise the trade can be repeated.
Inputs, screening stages and outputs. Specific formulas are not published.
Directional view, structure, capital and worst case at a glance. Filter by bias.
Structural characteristics of each tool. These are descriptions, not scores or rankings.
| Strategy | Directional view | Structure | Capital basis | Worst case |
|---|---|---|---|---|
| Covered calls | Neutral to bullish | 100 shares + short call | Cost of 100 shares | Stock falls, upside capped |
| Cash-secured puts | Neutral to bullish | Short put + cash | Strike x 100 in cash | Stock falls well below strike |
| Buy-write | Bullish to neutral | Buy shares + sell call together | Cost of 100 shares | Stock falls, upside capped |
| Wheel strategy | Neutral to bullish | Cash-secured put, then covered call | Strike x 100 in cash | Stock falls below strike |
| Bull put credit spreads | Bullish | Short put + lower long put | Width minus credit | Width minus credit, x 100 |
| Bear call credit spreads | Bearish to neutral | Short call + higher long call | Width minus credit | Width minus credit, x 100 |
| Bull call debit spreads | Bullish | Long call + higher short call | Net debit | The debit |
| Bear put debit spreads | Bearish | Long put + lower short put | Net debit | The debit |
| Iron condors | Range-bound | Put credit + call credit spread | Wider wing minus credit | Wider wing minus credit, x 100 |
| LEAPS | Bullish | One long-dated call | Call premium | The premium |
| Poor man's covered call (PMCC) | Bullish to neutral | Long-dated call + short-dated call | Net debit | Modeled, not a fixed figure |
These are research approaches, not claims about what every competing product does or does not offer.
| Research approach | Starting point | Your decision |
|---|---|---|
| Raw options-chain review | Individual strikes, expirations and quotes | Construct the position and calculate its economics |
| Rule-based screening | Contracts that meet selected filters | Evaluate the remaining candidates in context |
| TradingSignalAI | Ranked strategy-specific opportunities with capital, return and risk metrics | Inspect the legs, liquidity and payoff; execute independently with your broker |
Eligible new customers can begin a 7-day Premium trial. A payment method is required, and the selected plan bills automatically at the end of the trial unless canceled. Registration alone is not a Premium subscription.
| Capability | Free account | Premium |
|---|---|---|
| Record holdings and available cash | Included | Included |
| Browse universe research | Included | Included |
| Ranked strategy tools (11 strategies) | Not included | Included |
| Buy-Write and PMCC finders | Not included | Included |
| Options research | Not included | Included |
| Trade records, scan and performance history | Not included | Included |
This is a historical screenshot of the platform's symbol chart, shown to illustrate the interface. It is not live data and not a current market view.
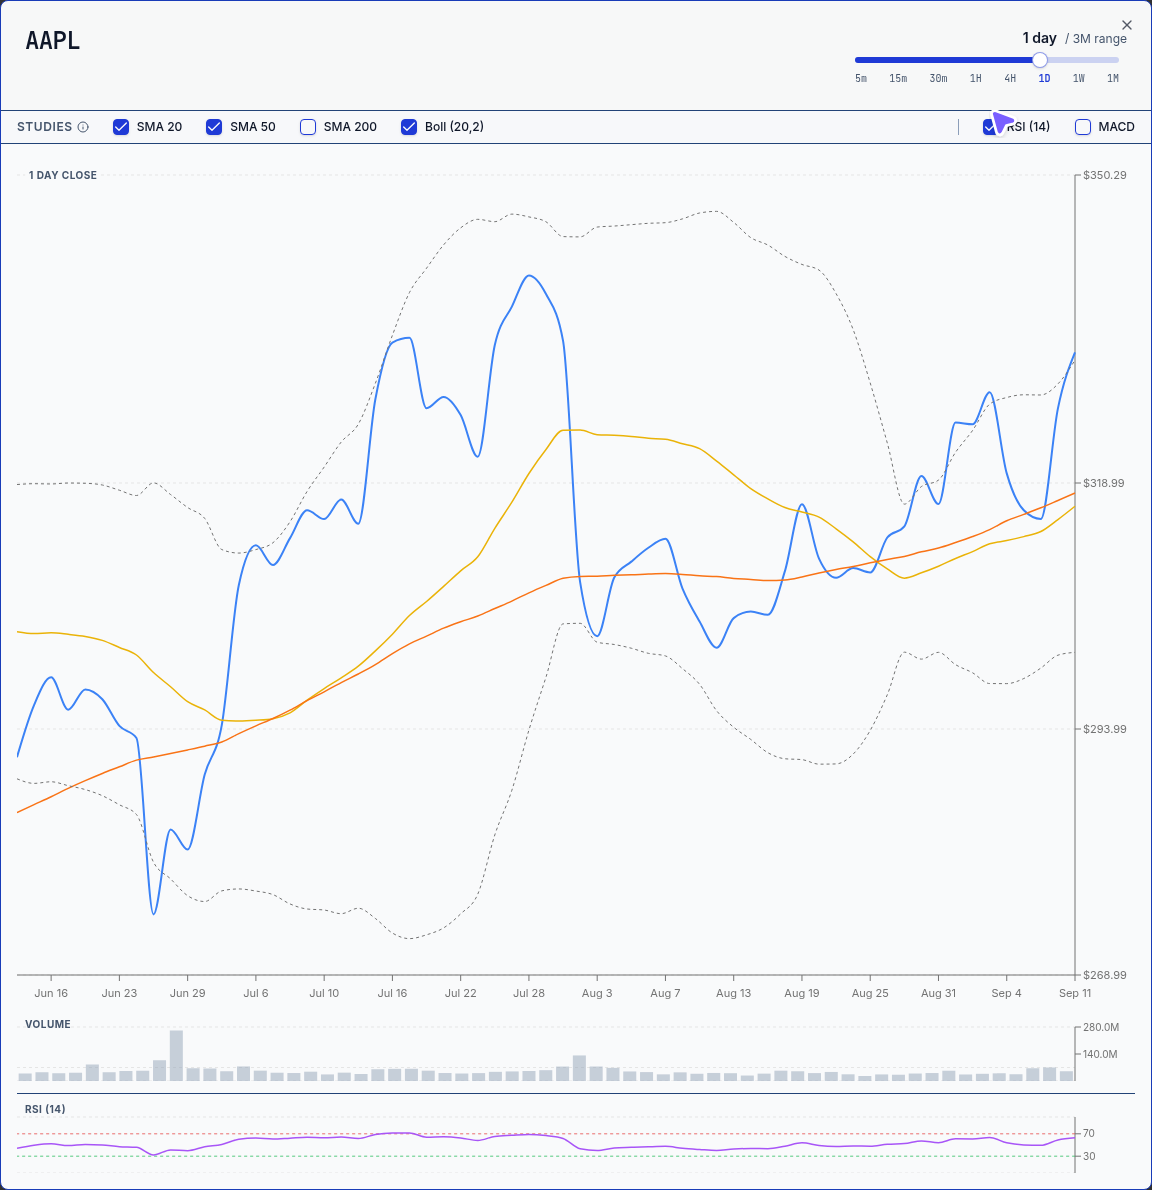
Historical screenshot, not live. Select the image to open it at full size.
Create a free account to record holdings and cash and browse universe research. Premium adds the strategy tools. Eligible new customers can start a 7-day Premium trial; a payment method is required and the plan bills automatically unless canceled. Registration alone is not a Premium subscription.